
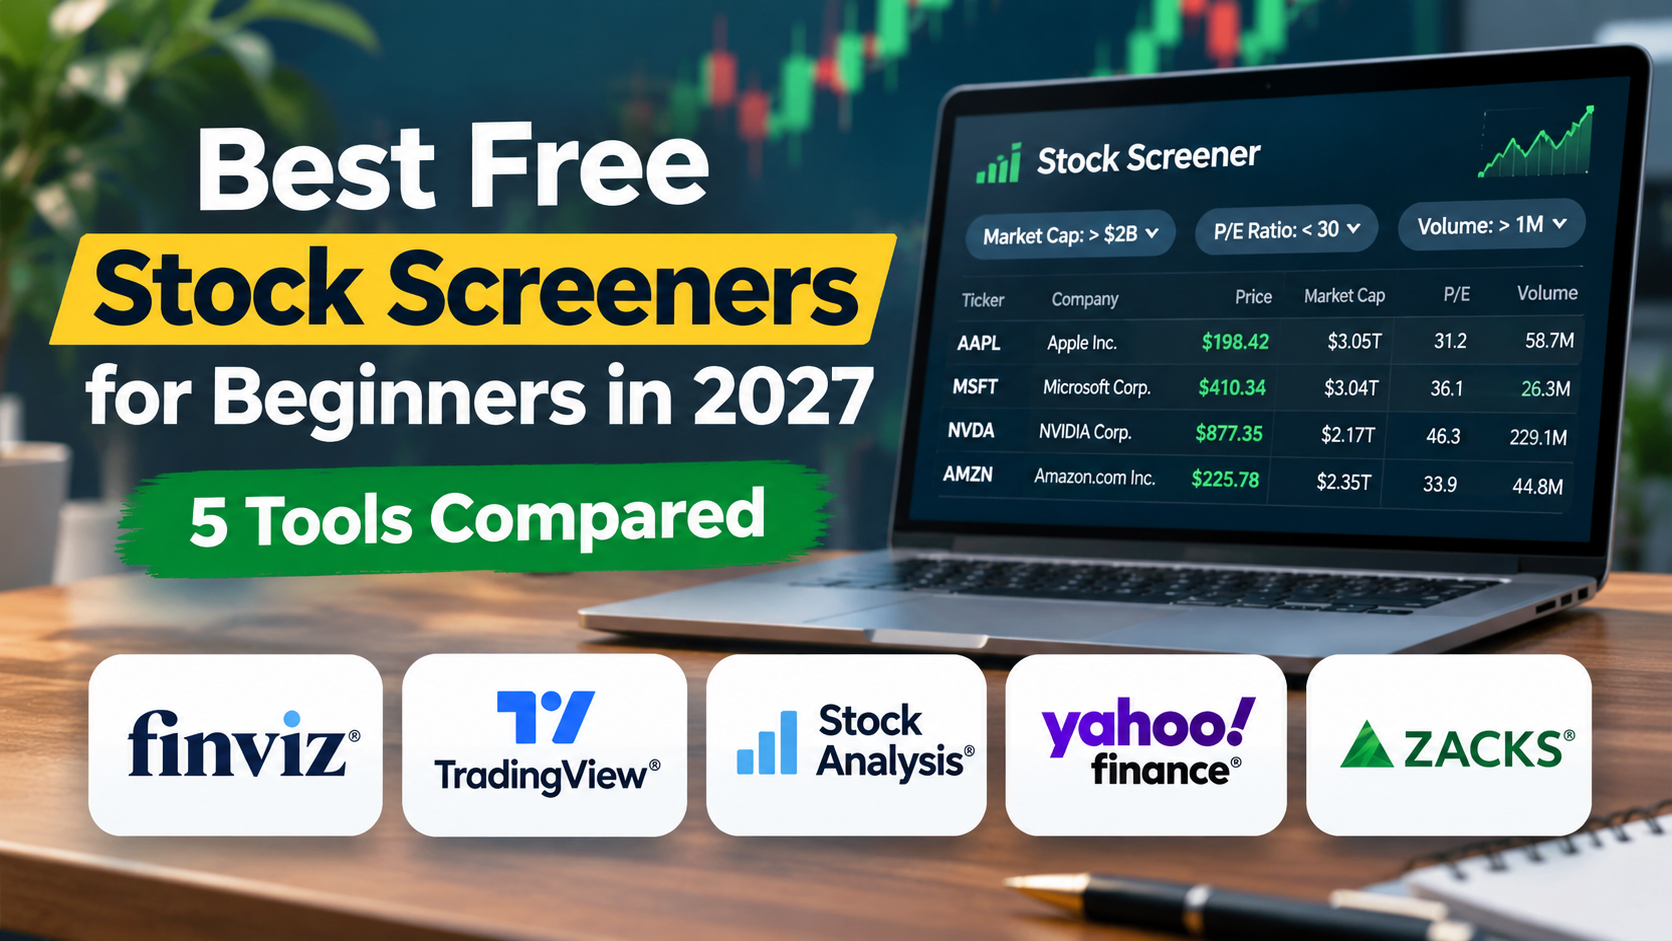

Looking for the best free stock screeners in 2027? Finviz, TradingView, Stock Analysis, Yahoo Finance, and Zacks are five useful platforms to consider. Each helps investors filter thousands of stocks using criteria such as market capitalization, price, trading volume, valuation ratios, and financial performance.
However, not every stock screener is designed for the same type of investor. Some are better for beginners, while others offer more advanced technical indicators or fundamental analysis.
In this guide, we’ll compare five free stock screeners, explain their advantages and limitations, and show you how to use screening filters to research U.S. stocks.
Quick answer: Finviz is our overall pick for flexible stock screening, Yahoo Finance is particularly approachable for beginners, TradingView is useful for chart-focused traders, Stock Analysis is strong for financial research, and Zacks is worth considering for earnings-oriented screening.
Editor’s note: This guide was prepared in November 2026 for readers researching stock screeners for 2027. Features, free-plan restrictions, and pricing may change.
What Is a Stock Screener?
A stock screener is an online tool that helps investors find stocks matching specific financial or market criteria.
Instead of manually researching thousands of publicly traded companies, investors can apply filters to narrow their search.
For example, suppose you want to find U.S. companies that meet these conditions:
- Market capitalization above $1 billion.
- Share price above $10.
- Average daily trading volume above 500,000 shares.
- Positive earnings.
- Price-to-earnings ratio below 25.
A stock screener can identify companies that match those requirements.
However, a stock passing your filters does not necessarily make it a good investment. Screening is only the first step in investment research.
Best Free Stock Screeners in 2027: Quick Comparison
| Stock screener | Best for | Notable features | Main limitation |
|---|---|---|---|
| Finviz | Overall stock screening | Fundamental and technical filters, heatmaps | Some advanced tools require Elite |
| TradingView | Technical analysis | Charts, indicators, financial and market filters | Free-plan limits on advanced workflows |
| Stock Analysis | Fundamental research | Financial metrics, valuation, company comparisons | Some advanced features require Pro |
| Yahoo Finance | Complete beginners | Familiar interface, market data, preset screens | Advanced research features may require payment |
| Zacks | Earnings-focused investors | Earnings estimates, valuation and screening tools | Premium research and screens are restricted |
These selections reflect our assessment of the platforms’ publicly documented features, not a controlled performance benchmark or paid ranking.
1. Finviz — Best Overall Free Stock Screener
Website: https://finviz.com/screener
Finviz is one of the most versatile stock-screening platforms for investors who want to combine fundamental and technical analysis.
Its screener organizes filters into descriptive, fundamental, and technical categories.
This makes it useful for investors who want to search for companies based on financial ratios, stock performance, and trading activity.
Key Features
Finviz provides screening criteria such as:
- Market capitalization.
- Sector and industry.
- Price-to-earnings ratio.
- Dividend yield.
- Average and relative trading volume.
- Share price.
- Shares outstanding.
- Moving averages and RSI.
The platform also includes stock market heatmaps, multiple screener views, and charts.
Finviz announced improvements to its free data feed in July 2026, reducing its stated delay to approximately one minute. Users should still verify the data timing relevant to their market and subscription.
How to Use Finviz
Suppose you want to identify liquid U.S. stocks with relatively large market capitalizations.
Start with these filters:
| Filter | Example setting |
|---|---|
| Country | USA |
| Market capitalization | Above $2 billion |
| Average volume | Above 1 million shares |
| Share price | Above $10 |
| P/E ratio | Under 30 |
After applying the filters, review the resulting companies individually.
Look at their revenue growth, financial statements, debt, and upcoming earnings dates.
Advantages
Finviz offers a broad range of filters and allows investors to combine several criteria in one search.
Its visual market heatmaps can also help users identify sectors experiencing unusual price movements.
Limitations
Some advanced capabilities, including certain customization and exporting features, require Finviz Elite.
In addition, filtering by a low P/E ratio does not automatically identify an undervalued stock.
Our verdict: Finviz is our overall recommendation for beginners who want to learn stock screening and gradually explore more advanced investing metrics.
2. TradingView — Best for Technical Analysis
Website: https://www.tradingview.com/
TradingView combines stock screening with an extensive charting environment.
It can be particularly useful for traders who want to find stocks matching specific technical conditions and then examine their price charts.
Key Features
TradingView’s Stock Screener supports categories including:
- Stock price and trading volume.
- Market capitalization.
- Moving averages.
- Technical indicators.
- Financial statements.
- Valuation ratios.
- Dividend metrics.
- Sector and exchange information.
The platform also provides predefined screening views.
How to Use TradingView
Imagine you’re looking for stocks that are trading above their 200-day moving average.
You can start with:
- Open the Stock Screener.
- Select the U.S. market.
- Add a moving-average-related filter.
- Configure the desired condition.
- Add a trading-volume filter.
- Review the matching stocks and their charts.
For example, you might look for companies trading above their long-term moving average with above-average trading volume.
However, a stock trading above its moving average is not guaranteed to continue rising.
Advantages
TradingView is especially useful when technical screening and chart analysis are part of the same workflow.
Investors can move from a list of matching stocks to a closer examination of price trends.
Limitations
Free-plan users may encounter restrictions on indicators, alerts, layouts, or other advanced features.
Our verdict: TradingView is a strong choice for investors interested in chart patterns, momentum, and technical analysis.
3. Stock Analysis — Best for Fundamental Stock Research
Website: https://stockanalysis.com/stocks/screener/
Stock Analysis is a financial research platform that combines screening with company fundamentals.
Its stock screener provides numerous filtering choices, including financial performance, valuation, analyst information, and dividends.
Key Features
The platform provides screening categories covering:
- Market capitalization.
- Stock price.
- Revenue and earnings metrics.
- Valuation ratios.
- Dividend information.
- Financial performance.
- Analyst-related data.
The screener also allows investors to explore company financial information after identifying potential candidates.
How to Use Stock Analysis
Suppose you’re researching profitable companies with relatively conservative valuations.
You could begin with the following example:
| Filter | Example condition |
|---|---|
| Market capitalization | Above $5 billion |
| P/E ratio | Between 5 and 25 |
| Return on equity | Positive |
| Revenue growth | Positive |
| Debt-related metrics | Review individually |
The purpose is to identify candidates for further research, not automatically select stocks to buy.
For each company, examine earnings quality, debt levels, free cash flow, and whether recent performance is sustainable.
Advantages
Stock Analysis offers a useful combination of screening and fundamental research.
Its financial data and valuation tools can help investors understand the companies behind the tickers.
Limitations
Some advanced research and customization capabilities require a paid subscription.
Data availability may also differ across companies and markets.
Our verdict: Stock Analysis is particularly useful for beginners who want to understand company fundamentals rather than focus exclusively on price charts.
4. Yahoo Finance — Best for Complete Beginners
Website: https://finance.yahoo.com/research-hub/screener/
Yahoo Finance is a familiar financial information platform offering market news, stock quotes, company information, and screening tools.
Its stock screener is a convenient starting point for people learning how to research investments.
Key Features
Yahoo Finance supports filters such as:
- Market capitalization.
- Stock price.
- Sector and industry.
- Trading volume.
- Valuation metrics.
- Price performance.
It also provides predefined screens, including active stocks, market gainers, and other investment categories.
How to Use Yahoo Finance
Suppose you want to research large U.S. technology companies.
Start by selecting the United States as the region.
Then apply filters for:
- Technology sector.
- Market capitalization above $10 billion.
- Average trading volume above 1 million shares.
- Positive earnings, where available.
Review the results and open individual company profiles for additional information.
Advantages
Yahoo Finance is approachable for beginners and integrates screening with general market research.
Investors can move between screening results, company pages, charts, and financial news.
Limitations
Certain advanced screening and research features are associated with paid plans.
Users should check which filters and saving capabilities are available with their current account.
Our verdict: Yahoo Finance is a practical first stock screener for beginners who want a straightforward introduction to investment research.
5. Zacks — Best for Earnings-Focused Screening
Website: https://www.zacks.com/screening/
Zacks Investment Research provides tools focused on company earnings, estimates, valuation, and stock selection.
Its screening resources can be useful for investors interested in earnings growth and analyst expectations.
Key Features
Zacks offers stock-screening resources that include:
- Custom stock screens.
- Earnings-related criteria.
- Valuation measures.
- Growth metrics.
- Predefined screening strategies.
- Additional premium screening tools.
How to Use Zacks
An earnings-focused investor might begin by searching for companies with:
- Positive earnings growth.
- Increasing earnings estimates.
- Reasonable valuation ratios.
- Adequate trading liquidity.
However, investors should understand that analyst estimates are forecasts, not guarantees.
Companies can miss expectations, and even strong earnings results do not guarantee higher share prices.
Advantages
Zacks provides a research environment particularly relevant to investors who study earnings expectations and revisions.
Limitations
Several specialized screens and research features require premium access.
The interface and terminology may also take time for beginners to learn.
Our verdict: Zacks is worth exploring after you understand basic stock screening, especially if earnings estimates are important to your investment approach.
Which Free Stock Screener Is Best for Beginners?
The best choice depends on what you want to accomplish.
If you’re completely new to stock research, Yahoo Finance offers a relatively approachable starting point.
If you want a broad collection of filters, Finviz is a strong option.
For technical analysis and chart-focused research, TradingView may be more suitable.
Investors interested in financial statements and valuation can explore Stock Analysis.
Meanwhile, Zacks may appeal to people who want to investigate earnings trends and estimates.
You do not need to use every platform. Start with one tool, learn the basic filters, and develop a consistent research process.
How to Use a Stock Screener: Step-by-Step Example
Let’s build a hypothetical stock screen for a beginner researching established U.S. companies.
Step 1: Select the Market
Choose U.S.-listed stocks.
This helps narrow the results to securities relevant to your investment interests.
Step 2: Apply a Market Capitalization Filter
Set market capitalization above $2 billion.
Market capitalization represents the total market value of a company’s outstanding shares.
Market capitalization = Share price × Shares outstanding
For example, a company with 200 million shares outstanding and a $25 stock price has a market capitalization of:
$25 × 200 million = $5 billion
Market capitalization can help classify company size, but it does not determine whether a stock is attractively valued.
Step 3: Apply a Trading Volume Filter
Set average daily trading volume above 500,000 shares.
This may help exclude some thinly traded stocks.
However, share volume alone does not fully measure liquidity. Bid-ask spreads and dollar trading volume also matter.
Step 4: Add a Valuation Filter
You could set a P/E ratio between 5 and 30.
This narrows the search to profitable companies trading within a selected earnings multiple range.
However, companies in different industries often have different typical valuations.
A P/E of 20 may be reasonable in one industry and expensive in another.
Step 5: Review Financial Quality
Examine revenue growth, profitability, debt, and cash flow.
A stock that passes numerical filters may still have financial weaknesses.
Step 6: Research the Company
Before making any investment decision, review the company’s latest financial reports, business model, competitive position, and major risks.
The screener should generate research ideas—not replace fundamental analysis.
Best Stock Screener Filters for Beginners
Here are several important metrics to understand.
| Filter | What it measures | Why it matters |
|---|---|---|
| Market cap | Total equity market value | Helps classify company size |
| P/E ratio | Price relative to earnings | Helps compare valuation |
| Revenue growth | Change in company sales | Indicates business expansion or contraction |
| Average volume | Typical shares traded | Helps assess trading activity |
| Dividend yield | Annual dividend relative to share price | Relevant to income investors |
| Debt-to-equity | Debt relative to shareholder equity | Helps evaluate financial leverage |
| Return on equity | Profitability relative to equity | Measures one aspect of capital efficiency |
| Relative volume | Current trading activity versus normal | Can identify unusual activity |
No single metric is sufficient to evaluate an investment.
For example, a low P/E ratio can reflect an attractive valuation, but it can also reflect deteriorating business prospects.
Can a Stock Screener Find Undervalued Stocks?
A stock screener can help identify potentially undervalued companies, but it cannot reliably determine intrinsic value on its own.
For example, an investor might filter for:
- P/E ratio below 15.
- Positive free cash flow.
- Moderate debt.
- Consistent profitability.
The results may contain interesting research candidates.
However, some companies trade at low valuations because their businesses face serious challenges.
Therefore, investors should examine the reasons behind a low valuation rather than assuming a cheap-looking stock is a bargain.
How to Find High-Volume Stocks Using a Free Screener
Trading volume is another useful screening metric.
For example, an investor researching actively traded stocks might use:
| Filter | Example setting |
|---|---|
| Share price | Above $5 |
| Average volume | Above 1 million |
| Relative volume | Above 1.5 |
| Market capitalization | Above $500 million |
These are illustrative research criteria, not trading recommendations.
A relative volume reading above 1.5 generally indicates that trading activity is elevated compared with the metric’s reference period.
However, unusual volume can result from both positive and negative developments.
Always investigate the reason for significant changes in trading activity.
Can You Use Stock Screeners to Find Options Trading Opportunities?
Yes. Stock screeners can help identify stocks that may be worth researching for options strategies.
For example, investors interested in covered calls or cash-secured puts may look for:
- Stocks they would be comfortable owning.
- Sufficient share trading liquidity.
- Financial stability.
- Reasonable valuations.
- Upcoming earnings announcements.
- Availability of listed options.
However, a stock screener alone cannot establish whether a particular option contract offers an attractive premium.
Options traders must also examine implied volatility, strike prices, expiration dates, open interest, bid-ask spreads, and assignment risks.
For readers learning these strategies, see our related guides:
Covered Calls Explained: How They Work, Examples, Profits, and Risks
Cash-Secured Puts Explained: How They Work, Examples, and Risks
These strategies involve significant risk and are not suitable for every investor.
Free vs. Paid Stock Screeners: Is Upgrading Worth It?
For most beginners, free screening tools provide enough functionality to learn the fundamentals.
A paid subscription may become useful if you need:
- Specialized financial metrics.
- More advanced technical indicators.
- Expanded historical datasets.
- Additional saved screens or alerts.
- Data exports.
- More sophisticated research workflows.
However, paying for additional features does not guarantee better investment results.
Before subscribing, identify the specific limitation that prevents you from completing your research.
If a free screener already provides the necessary information, upgrading may not be worthwhile.
Common Stock Screening Mistakes to Avoid
1. Using Too Many Filters
Adding excessive conditions can eliminate otherwise interesting companies.
Start with a small number of meaningful criteria.
2. Assuming Low-Priced Stocks Are Cheap
A $2 stock is not automatically cheaper than a $100 stock.
Share price must be considered alongside shares outstanding, market capitalization, financial performance, and valuation.
3. Ignoring Share Dilution
Companies may issue additional shares to raise capital.
An increase in shares outstanding can affect per-share metrics and the relationship between market capitalization and share price.
4. Relying on Outdated Data
Financial metrics change as companies report earnings, issue shares, or revise guidance.
Check the date and source of the data before relying on it.
5. Confusing Screening Results With Investment Recommendations
A screener identifies companies that match mathematical conditions.
It does not predict future stock returns.
6. Ignoring Industry Differences
Financial ratios should often be interpreted within the context of a company’s industry.
For example, valuation and profitability metrics can differ substantially between banks, software companies, and manufacturers.
Frequently Asked Questions
What Is the Best Free Stock Screener in 2027?
Finviz is our overall recommendation for its broad selection of fundamental and technical filters. However, Yahoo Finance may be easier for complete beginners, while TradingView is useful for technical analysis.
Is Finviz Free?
Yes. Finviz offers a free stock screener. Some advanced capabilities require a paid Elite subscription.
Does TradingView Have a Free Stock Screener?
TradingView provides stock-screening functionality, although some features and advanced workflows are restricted by subscription plan.
Is Yahoo Finance Good for Stock Screening?
Yes. Yahoo Finance provides stock screening tools and is a practical option for beginners researching stocks and market data.
Can a Stock Screener Predict Stock Prices?
No. A stock screener filters securities using available data and selected criteria. It cannot reliably predict future market prices.
Can I Screen Stocks by Market Capitalization?
Yes. Major stock screeners generally allow users to filter companies by market capitalization.
What Is the Difference Between Market Cap and Stock Price?
Stock price is the market value of one share.
Market capitalization represents the total market value of all outstanding shares.
A company can have a low share price and a large market capitalization if it has many shares outstanding.
Are Free Stock Screeners Accurate?
Free stock screeners can provide useful financial and market data, but accuracy depends on data providers, update schedules, and the definitions used for each metric.
Always verify important figures against company filings and reliable financial sources.
Can Beginners Use Stock Screeners?
Yes. Beginners can start with simple filters such as market cap, sector, price, and volume, then gradually learn more advanced financial metrics.
Final Thoughts: Choosing the Best Free Stock Screener
The best free stock screener is the one that helps you research investments efficiently and understand the results.
For broad stock screening, Finviz is a strong starting point.
TradingView is particularly useful for chart-focused research, while Stock Analysis provides an appealing environment for fundamental analysis.
Yahoo Finance is approachable for new investors, and Zacks offers resources for earnings-focused research.
Regardless of the platform, remember that screening is only the beginning.
A disciplined investment process also requires examining financial statements, understanding company risks, and evaluating whether a stock fits your investment objectives.
The goal is not to find a stock that looks attractive on a screen. It is to understand why the company deserves further research.
Sources and Further Reading
- Finviz Stock Screener
- Finviz Screener Documentation
- TradingView Stock Screener
- Stock Analysis Stock Screener
- Yahoo Finance Screeners
- Zacks Screening Tools
Financial disclaimer: This article is for educational purposes only and does not constitute personalized financial or investment advice. Stock investing involves risk, including the possible loss of principal. The screening examples are hypothetical and are not recommendations to buy or sell any securities.
